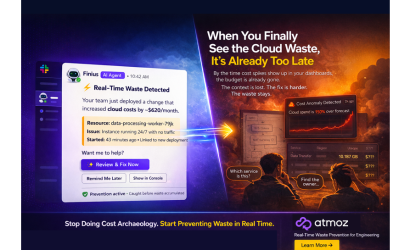
Monday morning. The dashboards are green. No alerts. No incidents. Life is good.
Three weeks later, Finance forwards the cloud invoice.
You burned $22,000 over that happy weekend.
But nothing failed.
No outage. No anomaly. Just GPU instances left running after a Friday experiment—quietly consuming budget while every operational dashboard said the infrastructure was healthy.
That is the cloud waste problem.
The problem isn’t visibility. It’s timing.
Most organizations can eventually see where cloud spend went. The problem is that they often see it after the money is already gone.
Healthy Infrastructure Can Still Be Wasting Money
Operational dashboards are designed to answer questions such as:
- Is the service running?
- Is latency acceptable?
- Is memory or CPU utilization healthy?
- Is anything failing?
Those are essential questions.
But healthy does not mean cost-efficient.
A workload can be stable and oversized.
A GPU can be running perfectly while doing nothing useful.
A service can meet every availability target while costing far more than necessary.
That is why cloud cost reviews so often end with:
“Nothing broke. We just didn’t notice.”
Cloud waste rarely needs an outage to exist.
Billing-Based Cloud Cost Management Starts Too Late
Cloud cost is created when engineers make decisions:
A resource is provisioned.
A workload is scaled.
A GPU experiment starts.
A temporary environment stays online.
An oversized instance is deployed.
The financial impact starts immediately.
But billing-derived cost data arrives later.
That gap matters.
The FinOps Foundation increasingly distinguishes between billing-derived signals and execution-aware signals: billing can tell you that spend changed, while execution data can identify the behavior causing it while something can still be done about it.
That gap between engineering action and financial feedback is where cloud waste survives.
Cloud Cost Reporting Is Not Cloud Cost Control
Traditional cloud cost management has become very good at explaining spend.
Tools can categorize costs, identify trends, allocate spend, detect anomalies, and produce detailed reports.
That visibility is valuable.
But visibility alone does not prevent waste.
A recommendation discovered days later still requires someone to:
identify the owner → understand the context → create a ticket → contact engineering → validate the change → implement it.
By then, the engineer may have moved on and the waste may already have repeated hundreds of times.
This is why cloud waste prevention needs to move closer to the engineering decision itself.
FinOps guidance is moving in the same direction, emphasizing shifted-left anomaly detection and getting alerts to responsible owners directly in engineering workflows.
The Cost Signal Needs to Reach the Engineer
Engineers do not spend their day inside cloud billing dashboards.
They work in IDEs, Slack, Teams, GitHub, Terraform, CI/CD pipelines, and cloud consoles.
Yet engineers are the people making the decisions that create cloud cost.
So the cost signal needs to reach them while the engineering context still exists.
Not:
“Last month this workload cost too much.”
But:
“This workload is projected to cost $4,800/month. A lower-cost configuration can deliver the same requirement for $2,900. Do you want to change it?”
That is the difference between reporting waste and preventing it.
AI Makes the Timing Problem More Urgent
AI accelerates the problem.
GPU-heavy experiments, idle AI environments, model calls, retries, agent loops, and duplicated pipelines can create significant and unpredictable spend much faster than traditional infrastructure.
An AI agent can turn one user request into dozens of model calls. Unexpected loops can generate hundreds or thousands of calls if limits are not in place. The FinOps Foundation specifically identifies agent-level attribution, iteration limits, token consumption, retry rates, and GPU utilization as important AI cost controls.
And the gap is already visible in enterprise data: Harness’s 2026 State of AI in FinOps survey found that 72% of respondents had experienced a surprise AI bill and estimated that 26% of AI spend was wasted. It also found that engineers often lack cost information when model, prompt, and retry decisions are being made.
The pattern is the same as cloud—only faster:
Engineering creates cost in seconds. Financial visibility arrives later.
What Needs to Change
The answer is not another dashboard.
Engineering, DevOps, Platform, and FinOps teams need cloud cost visibility at the moment decisions are made:
- before idle GPU and AI workloads keep running
- before oversized infrastructure reaches production
- before a temporary environment becomes permanent
- before repeated retries or agent loops multiply spend
- before an inefficient engineering decision becomes recurring cloud waste
The goal is not to give engineers more reports.
It is to give them the cost, context, ownership, and recommended action while they can still change the outcome.
From Cloud Cost Visibility to Cloud Waste Prevention
Cloud FinOps has made enormous progress in helping organizations understand where money goes.
The next step is moving from visibility to intervention.
From:
What did we spend?
to:
What are we about to spend—and should we?
From:
Where was the waste?
to:
Can we prevent it now?
The next generation of cloud cost optimization will not be defined by better retrospective reporting.
It will be defined by earlier decisions.
Because the best time to find cloud waste is not when the invoice arrives.
It is before the waste becomes spend.